I love it when apps collect my data!
Anyway, a little backstory: I've had Spotify since 2021, and I've been told this is "psychopathic behavior," but
I listen to my "Liked Songs" library on repeat rather than make playlists. Hence, the library currently has 1,000+
songs that I just hit shuffle on.
This resulted in a huge database to analyze my emotions and growth over the years!
I extracted the data using spotipy,
a Python library for the Spotify Web API:
        import csv
        import spotipy
        from spotipy.oauth2 import SpotifyOAuth
        import spotipy.util as util

        client_id = "not-telling-but-i-generated-it"
        client_secret = "its-a-secret"
        redirect_uri = "http://localhost:3000/callback"
        scope = "user-library-read"

        sp = spotipy.Spotify(auth_manager=SpotifyOAuth(client_id=client_id,
                                                       client_secret=client_secret,
                                                       redirect_uri=redirect_uri,
                                                       scope=scope))


        results = sp.current_user_saved_tracks(limit=50)
        tracks = results['items']
        while results['next']:
            results = sp.next(results)
            tracks.extend(results['items'])

        with open('liked_songs.csv', 'w', newline='') as file:
            writer = csv.writer(file)
            writer.writerow(['name', 'artist', 'album', 'energy', 'danceability', 'tempo', 'valence', 'date'])
            for track in tracks:
                track_name = track['track']['name']
                artist_name = track['track']['artists'][0]['name']
                album_name = track['track']['album']['name']
                track_id = track['track']['id']
                audio_features = sp.audio_features(track_id)[0]
                energy = audio_features['energy']
                danceability = audio_features['danceability']
                tempo = audio_features['tempo']
                valence = audio_features['valence']
                added_at = track['added_at']
                writer.writerow([track_name, artist_name, album_name, energy, danceability, tempo, valence, added_at])
With the resulting csv file, I imported it into R to do the rest of the cleanup:
        spotify <- read_csv("data/liked_songs.csv")

        spotify_clean <- spotify %>%
            mutate(year=lubridate::year(date)) %>%
            mutate(month=lubridate::month(date, label=TRUE, abbr=TRUE)) %>%
            mutate(day=lubridate::day(date)) %>%
            mutate(time=substr(date, 12, 19)) %>%
            select(year, month, day, time, energy, danceability, tempo, valence, name, artist)
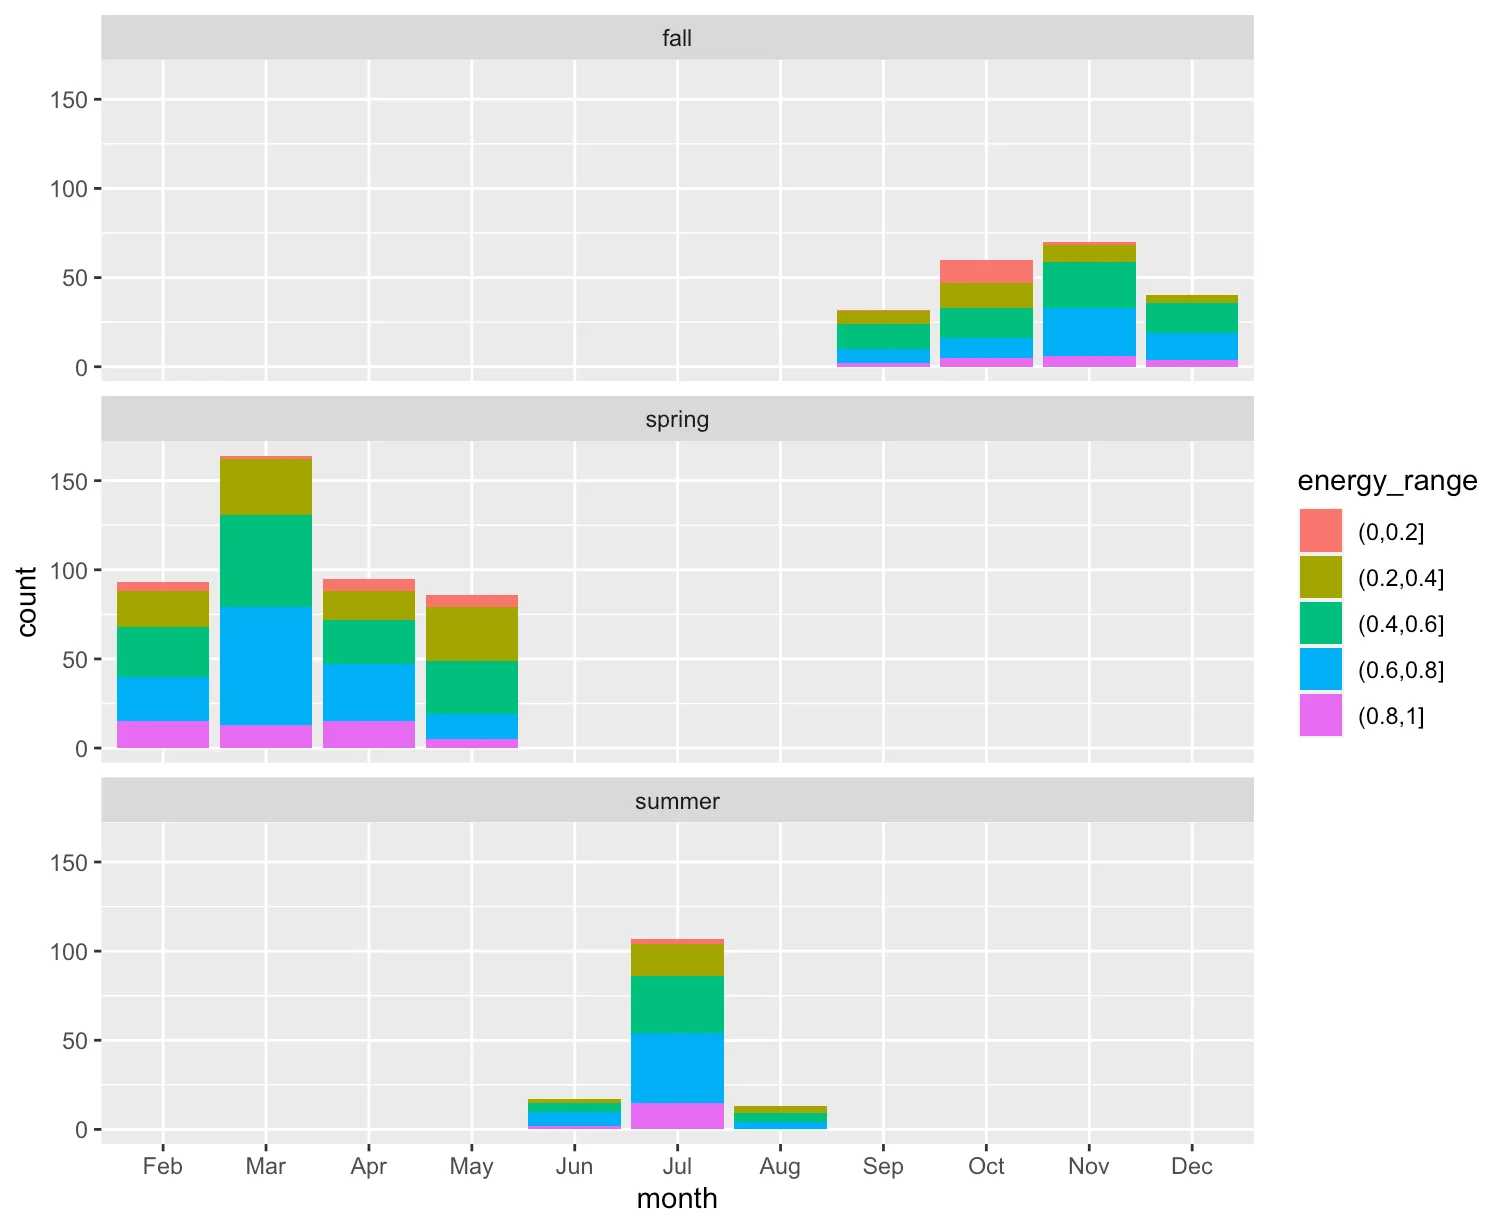
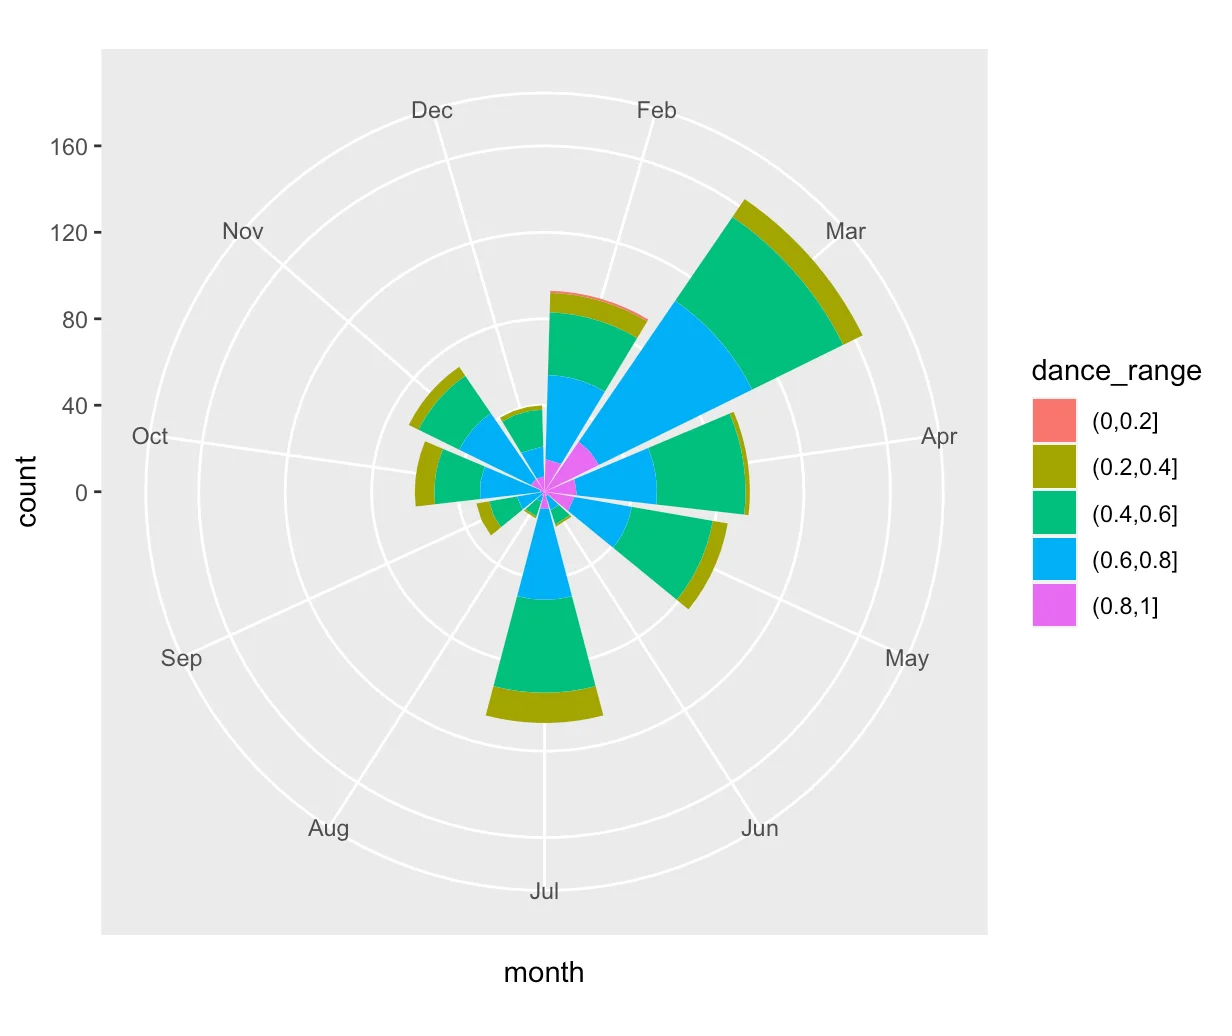
Here are the summary stats! No idea how it works, but I love that Spotify has these silly indexes
for each songs.
        spotify_stats <- spotify_clean %>%
        group_by(month) %>%
        summarize(count=n(),
                  mean_energy = mean(energy),
                  mean_danceability = mean(danceability),
                  mean_tempo = mean(tempo),
                  mean_valence = mean(valence)) %>%
        ungroup()
        > spotify_stats
        # A tibble: 12 × 6
        month count mean_energy mean_danceability mean_tempo mean_valence

           1   229       0.624             0.649       127.        0.523
           2    93       0.556             0.620       120.        0.443
           3   164       0.565             0.653       116.        0.462
           4    95       0.574             0.638       120.        0.507
           5    86       0.452             0.614       125.        0.388
           6    17       0.599             0.584       122.        0.472
           7   107       0.573             0.586       120.        0.470
           8    13       0.495             0.596       104.        0.389
           9    32       0.499             0.562       126.        0.313
         10    60       0.444             0.578       115.        0.366
         11    70       0.576             0.621       116.        0.506
         12    40       0.585             0.631       120.        0.510