These graphs were partly made as part of the MA 415 course at Boston University!
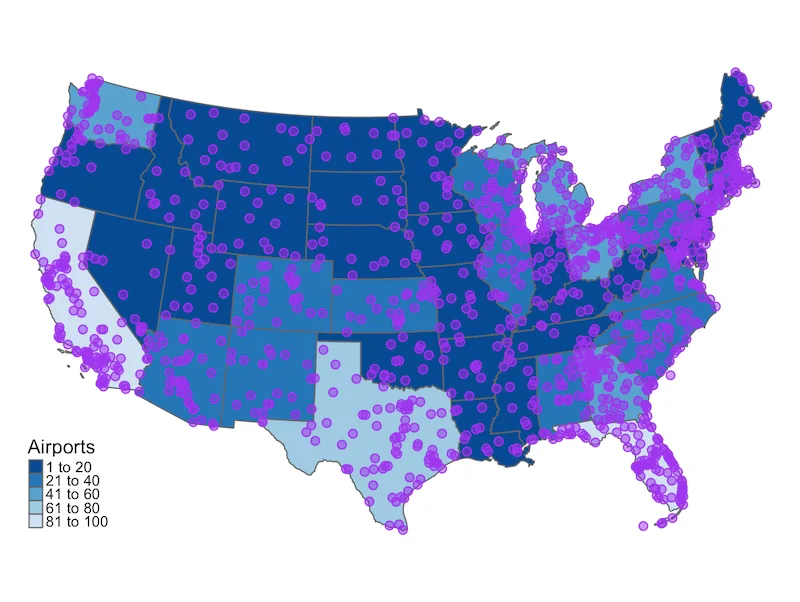
Data is from one of the CRAN packages that comes with R,
nycflights13
(contains airline data on flights departing NYC in 2013).
Below is some stuff I did with these fun data sets!
# load the package(s)
library(nycflights13)
library(tidyverse)
library(ggplot2)