These graphs were all made as part of the MA 415 course at Boston University!
Data is taken from
Analyze Boston
(City of Boston's open data hub) and updated up to 2022.
Below is information on the code (all written in R) and the thought process.
# packages used for this study (tmap and oldmaptools needs to be pre-installed)
library(tidyverse)
library(ggplot2)
library(sf)
library(tmap)
library(oldmaptools)

# constant values for universal coordinate system
epsg_wgs84 <- 4326
epsg_us <- 2163
epsg_ma <- 6492

# filter only allston data from boston subdistrict data, set to standard crs:
allston_subdistricts <- st_read("data/Boston_Zoning_Subdistricts") %>%
        filter(DISTRICT == "Allston/Brighton Neighborhood") %>%
        st_transform(epsg_ma)

# get data on accidents, transform to standard crs + sf, and filter only allston data:
accidents <- read_csv("data/accidents-boston-2022.csv") %>%
  st_as_sf(coords = c("Long", "Lat")) %>%
  st_set_crs(epsg_wgs84) %>% st_transform(epsg_ma) %>%
  filter(lengths(st_intersects(., allston_subdistricts)) > 0)

# join the two datasets:
allston_accidents <- allston_subdistricts %>% st_join(accidents) %>% count(OBJECTID)
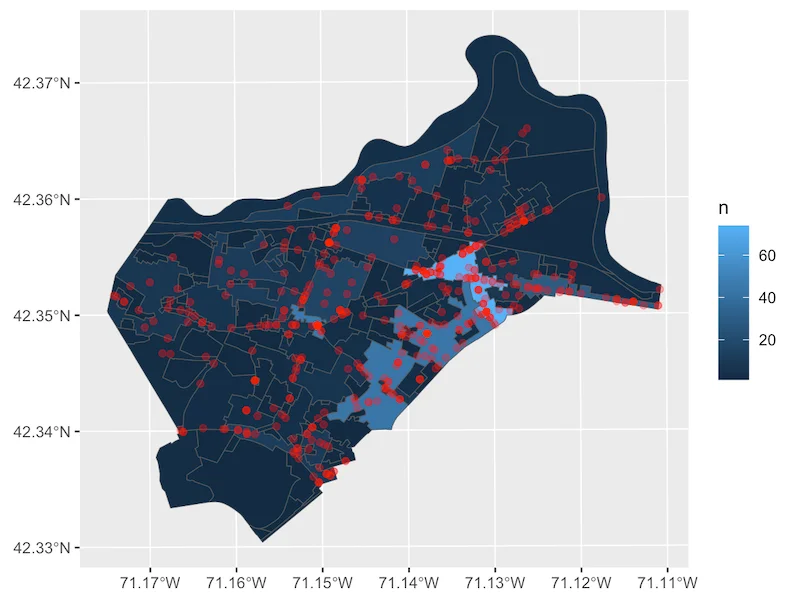
Starting with my dependable ggplot() function:
  ggplot() +
    geom_sf(aes(fill = n), data = allston_accidents) +
    geom_sf(color = "red", alpha = .3, data = accidents)
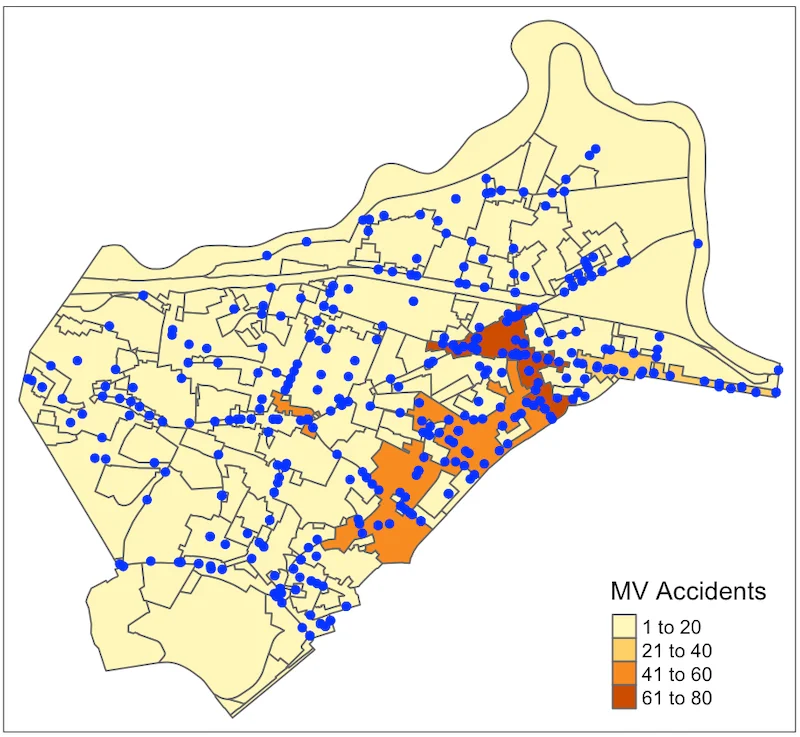
Experimenting with the tmap library:
  tm_shape(allston_accidents) +
    tm_polygons(col="n", title="MV Accidents") +
  tm_shape(accidents) +
    tm_symbols(col="blue", border.col="blue", size=0.1)
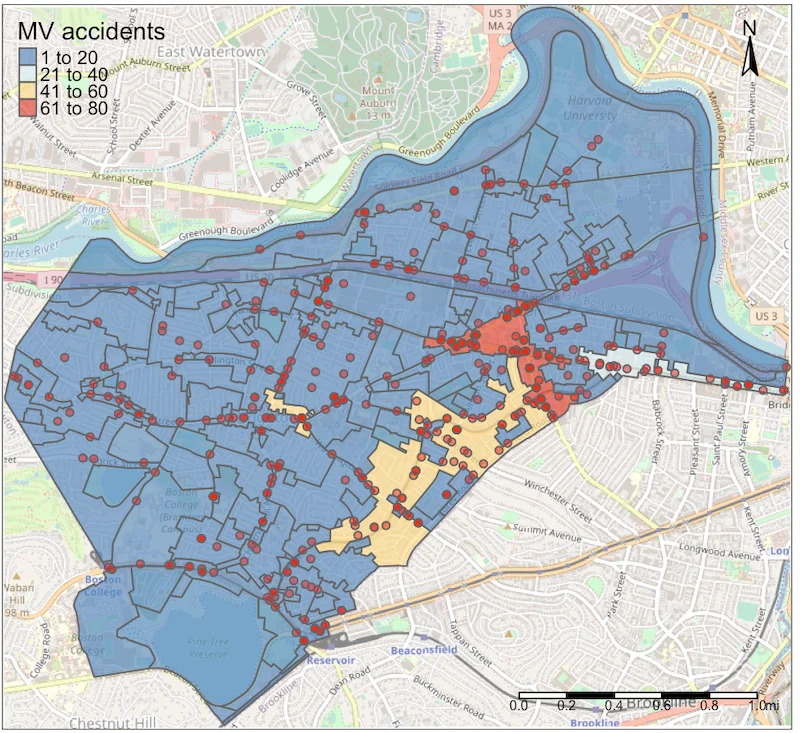
Using oldmaptools to overlay on satellite image:
  allston_osm <- tmaptools::read_osm(allston_subdistricts)
  accidents_dens <- smooth_map(accidents, bandwidth = .5,
    cover = allston_subdistricts)


  tm_shape(allston_osm, projection = epsg_ma, unit = "mi") +
    tm_rgb(alpha = .8) +
  tm_shape(allston_accidents) +
    tm_polygons(col = "n", alpha = .7, palette = "-RdYlBu",
    title = "MV accidents") +
  tm_shape(accidents) +
    tm_symbols(col = "red", size = .1, alpha = .5) +
    tm_compass(position = c("right", "top")) +
    tm_scale_bar(position = c("right", "bottom"))